Smart Meter Atlas - Mapping Germany’s Smart Meter Reality
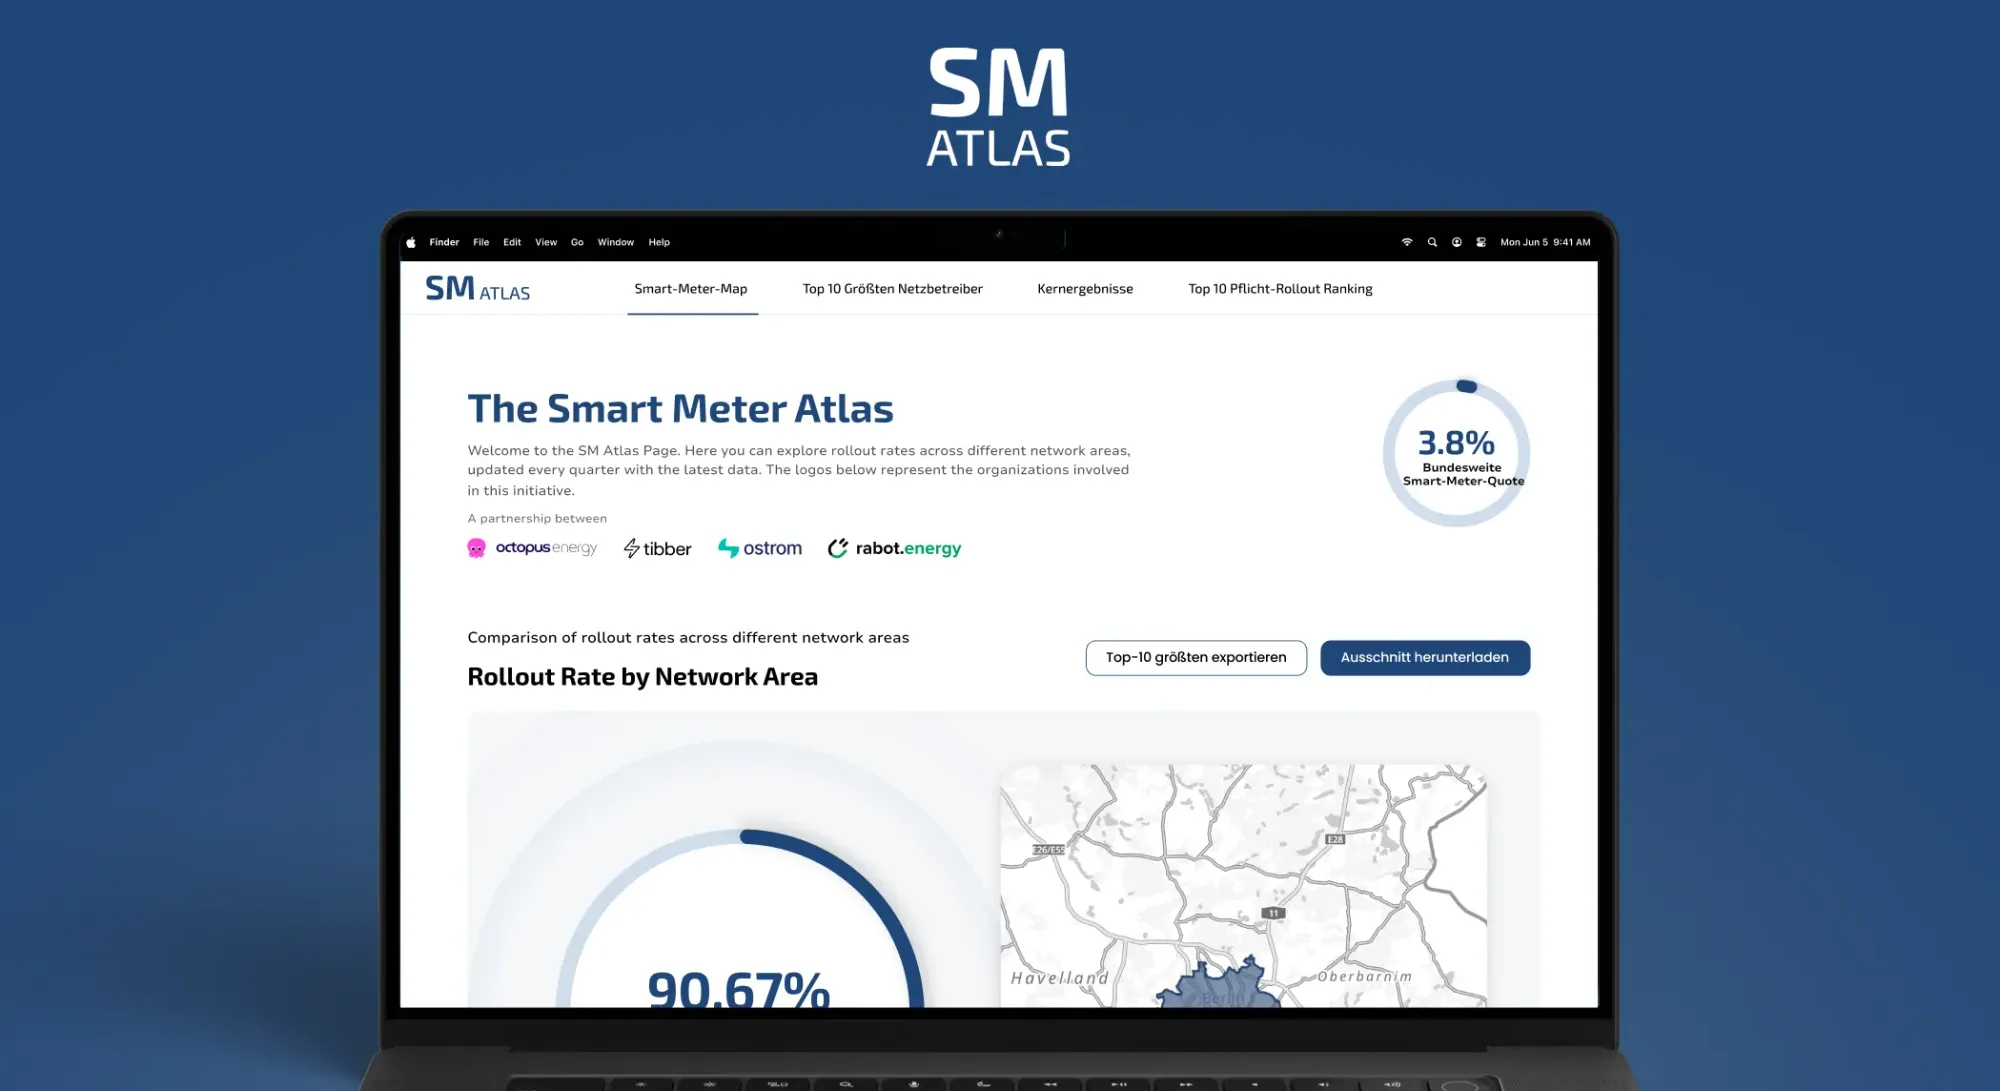
A neutral, data-driven platform that turns Germany’s smart meter rollout from a black box into a transparent, checkable reality - down to the local level.
The Deliverables
- Public-facing product concept & MVP
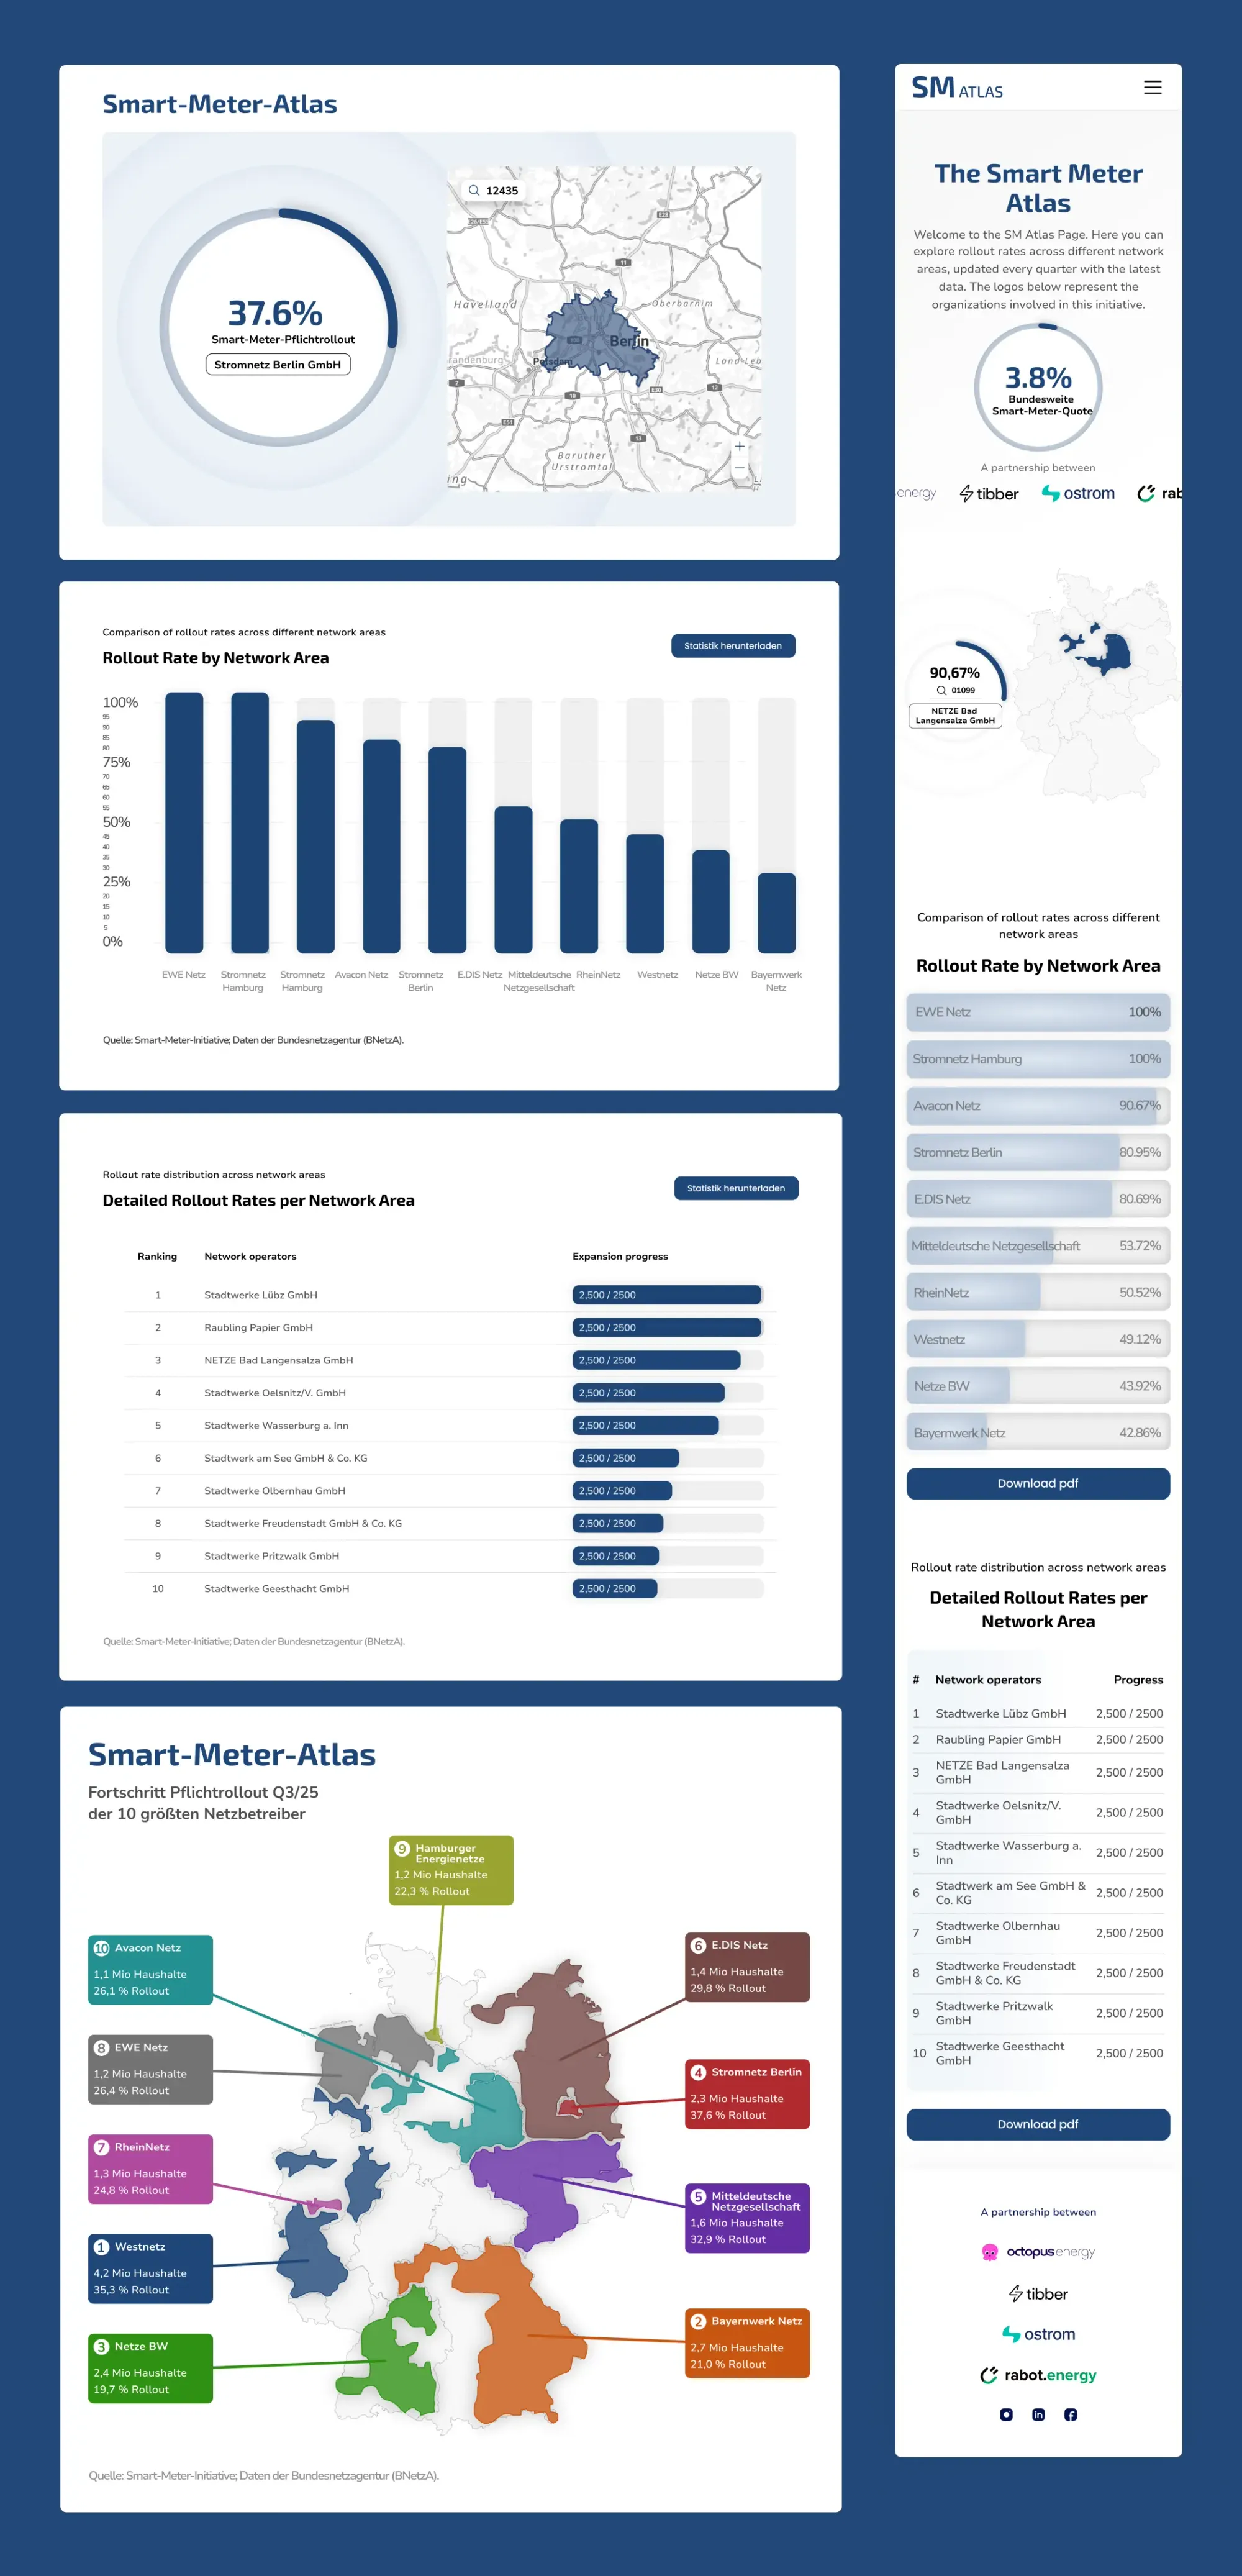
- Interactive Germany-wide rollout map
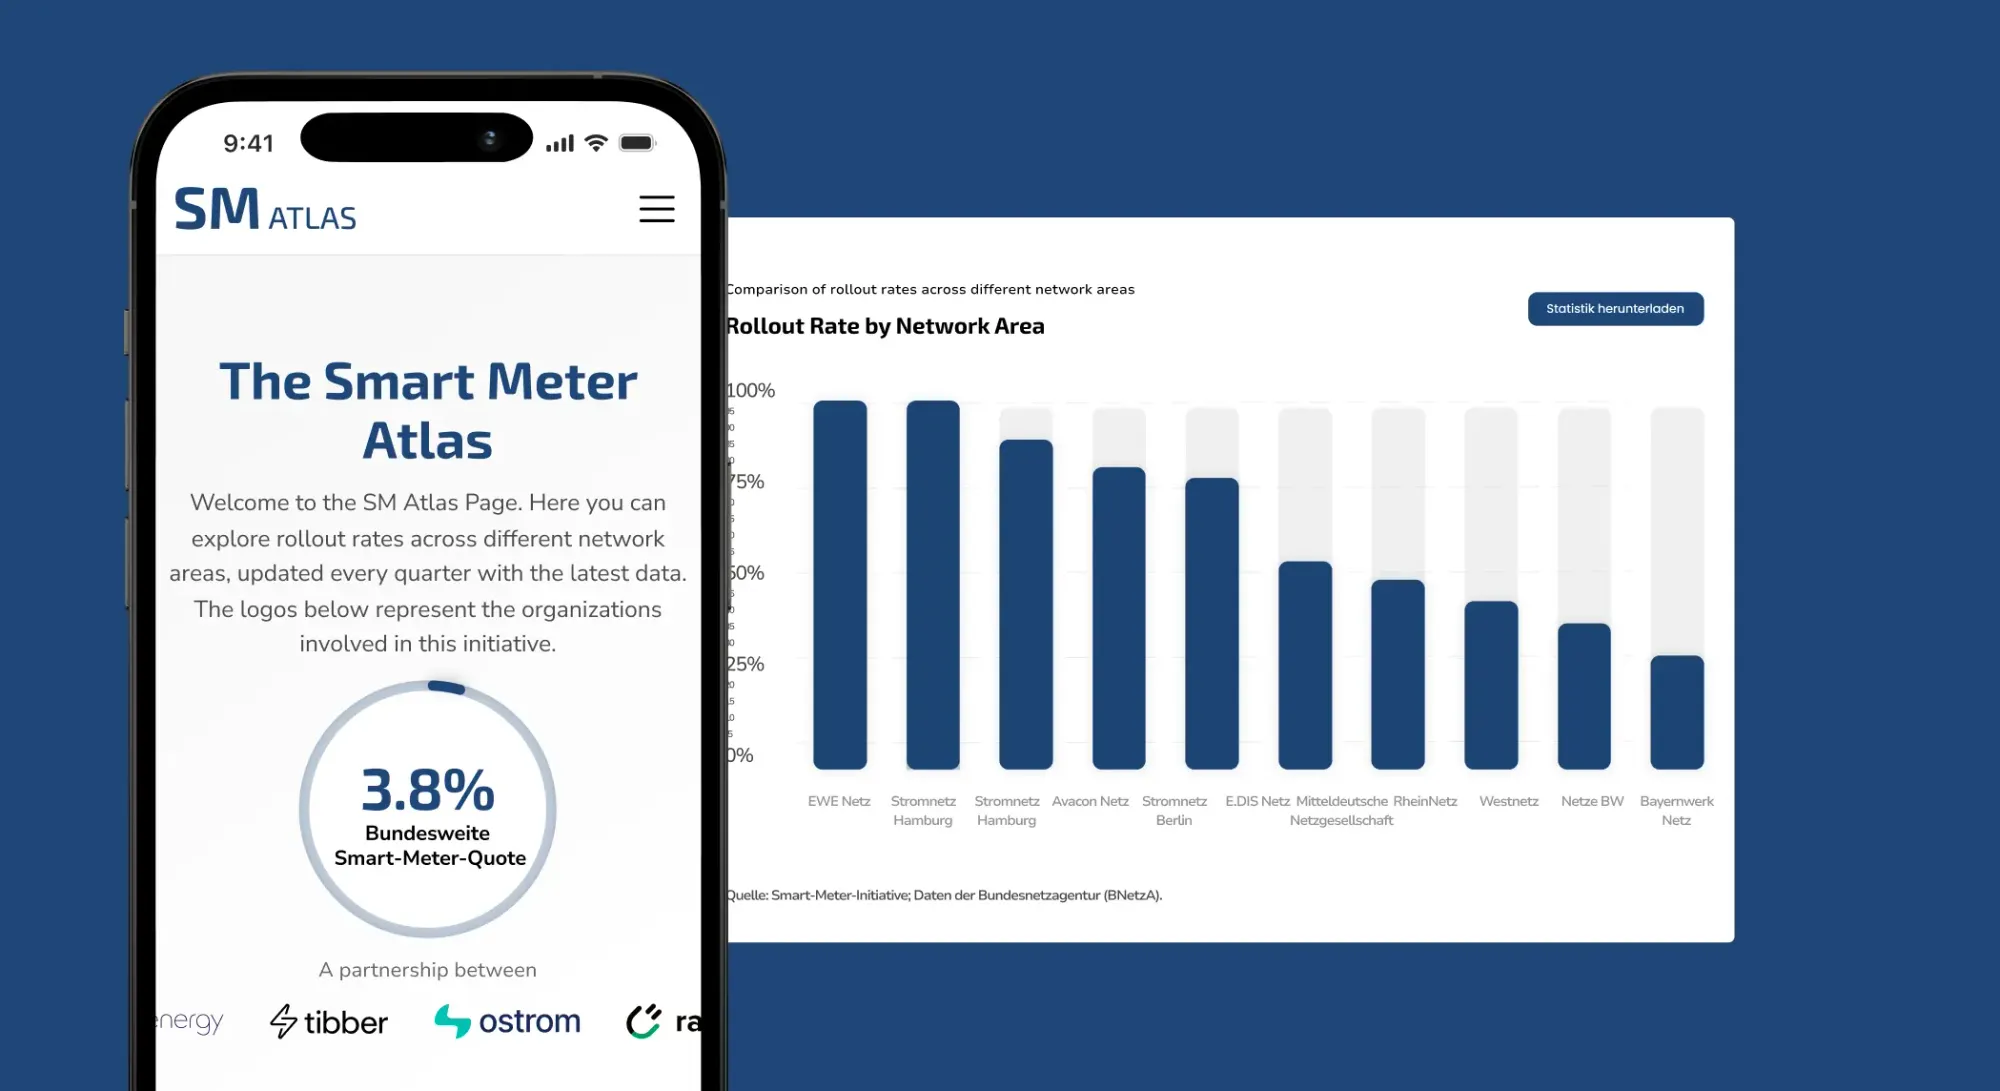
- Regional & network-operator quota visualization
- Data pipeline & update logic (quarterly)
- Scalable geospatial infrastructure (PMTiles)
The Challenge
Germany’s smart meter rollout is legally mandated but largely opaque. While quotas exist, progress was only visible in fragmented reports and national averages, making it impossible for users, press, or stakeholders to understand where rollout is actually happening, who is lagging behind, and why it matters for the energy transition.
The Solution
MVST built Smart Meter Atlas as a lean, neutral-branded transparency layer for the entire ecosystem.
- Joint initiative by Octopus Energy, Tibber, Ostrom, and Rabot Energy
- Interactive map showing rollout quotas per region, ZIP code, and network operator
- Vector-tile based geospatial rendering using large-scale German datasets
- Automated data mapping between operator regions and maintained quota data
- Clear, legible UX that works for consumers, journalists, and policymakers alike
The Results
The Atlas quickly proved its relevance beyond the product itself.
- Public transparency on rollout progress for ~814 German operators
- Revealed that ~85% of operators miss the legal rollout quota
- Featured by Handelsblatt as a key reference
- Used as a factual basis for public debate, regulators, and consumers
- Established a single source of truth across national, regional, and operator levels
Interested in building something similar?
The Smart Meter Atlas shows how complex regulatory and public data can be turned into a clear, user-centric product.
If you’re facing a similar challenge - creating transparency, making data understandable, or building a public-facing tool - let’s talk.
BlogBits und Bytes voller digitaler Einblicke.
Praxisnahe Einblicke zu KI-Integration, Headless E-Commerce, UX/UI-Design und digitaler Produktentwicklung. Fallstudien, Implementierungsleitfäden und Expertenperspektiven vom MVST-Team in München und Barcelona.
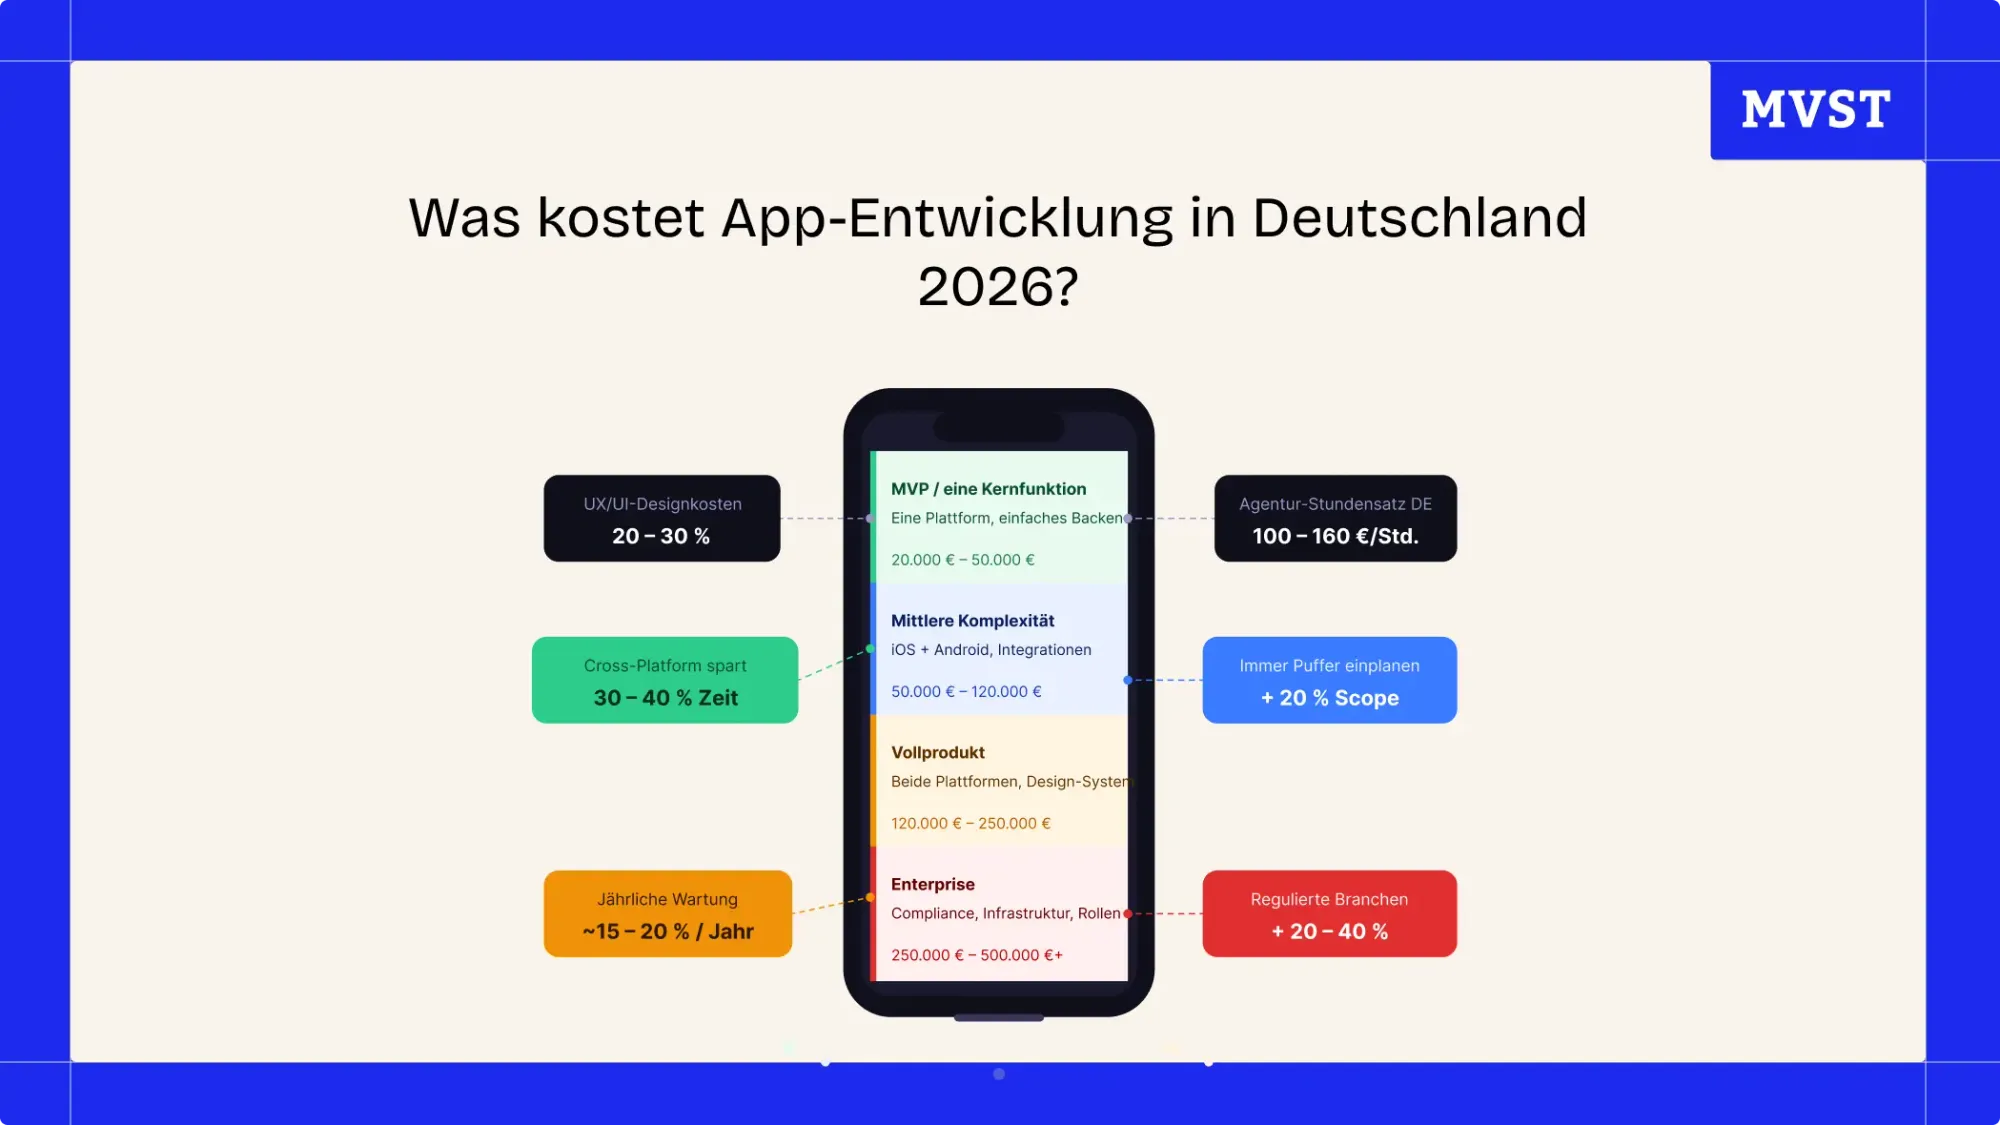
Was kostet App-Entwicklung in Deutschland 2026?
Ghida El Badri17. Juni 2026
Die besten KI-Events in Barcelona 2026
Ghida El Badri16. Juni 2026
6 KPIs, die jede Digital-Agentur tracken sollte
Ghida El Badri28. Mai 2026